Qury

Turn messy data into
decisions you can defend.

Search or jump to...
JD
sales_data_q4
customers_2024
Ask a question about your data...
Gemini 2.0 Flash

Flexible like AI
Reliable like data systems.

You can't verify a chatbot

You get an answer, but no way to check how it got there.

sales_data_q4.csv

File

Which region had the highest churn last quarter?

The EMEA region had the highest churn at 18.3%, followed by APAC at 14.7%.

Which rows did you use for that?

I grouped the data by region and calculated churn rates. I'm not able to show the specific rows or the exact steps I used to reach that number.

Dashboards weren't built for questions

You get a wall of charts, but no way to ask something new.

Q4 Revenue Overview
View only
Revenue
Users
Churn
MRR
Trend
Region
Funnel
Top Accounts
Region
Quarter
Product
Segment
Team
Status
Cohort Retention
Pipeline

Ask anything. Verify everything.

You ask a question and see exactly how the answer was reached.

Which region had the highest churn last quarter?

EMEA had the highest churn at 18.3%, followed by APAC at 14.7%.

SQL
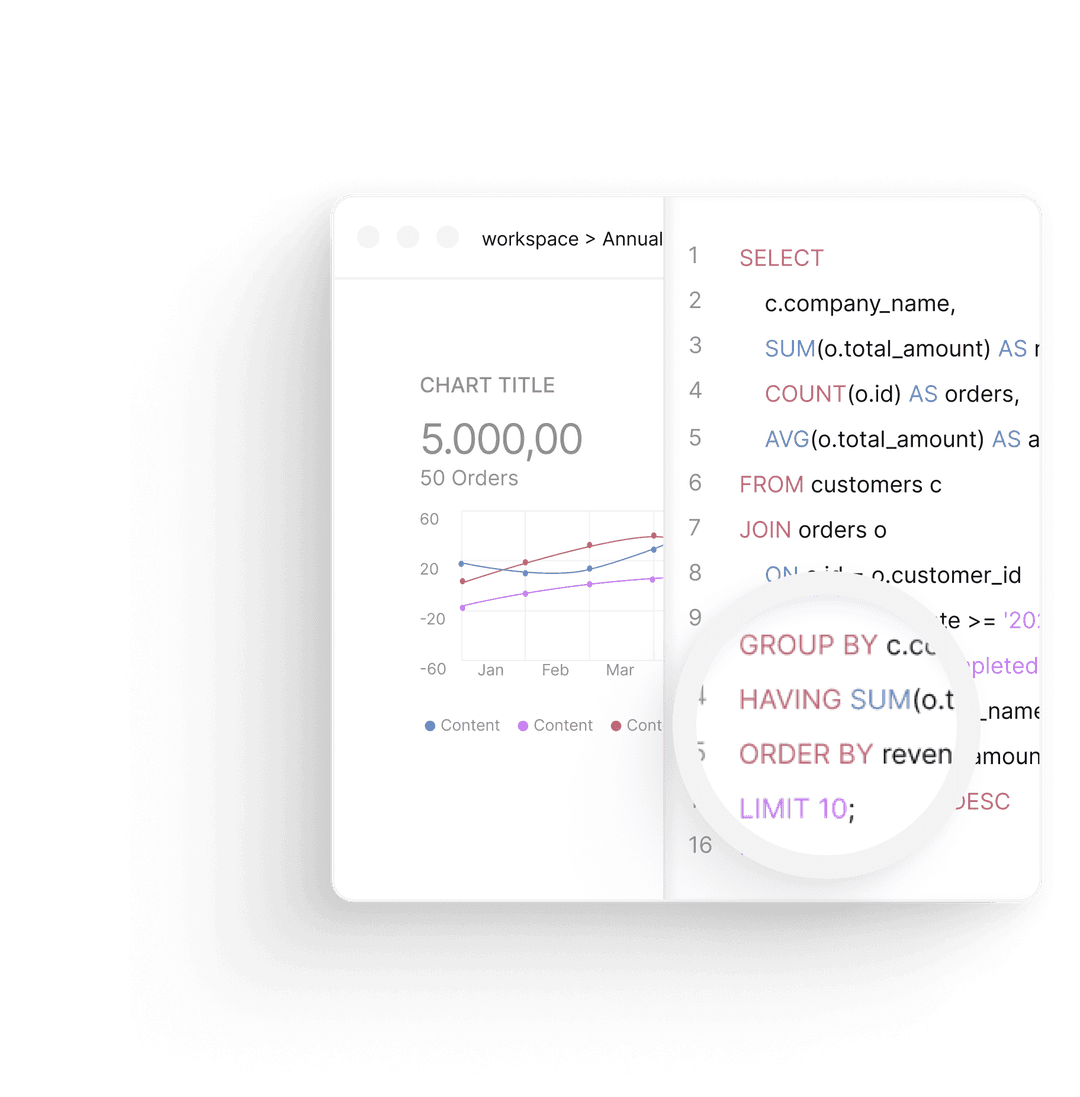
SELECT region, churn_rate
FROM customers
GROUP BY region
ORDER BY churn_rate DESC
LineBarTable

From raw file to verified answer in three steps.

Upload your data

Drop a CSV or connect a database. We handle the cleanup.

Drop your files here

or click to browse

Ask in plain English

Type a question like you'd ask a colleague.

Our top-performing channel last month?

Compare Q3 vs Q4 revenue by product

Ask a question...
Gemini 2.0 Flash

Trace every answer

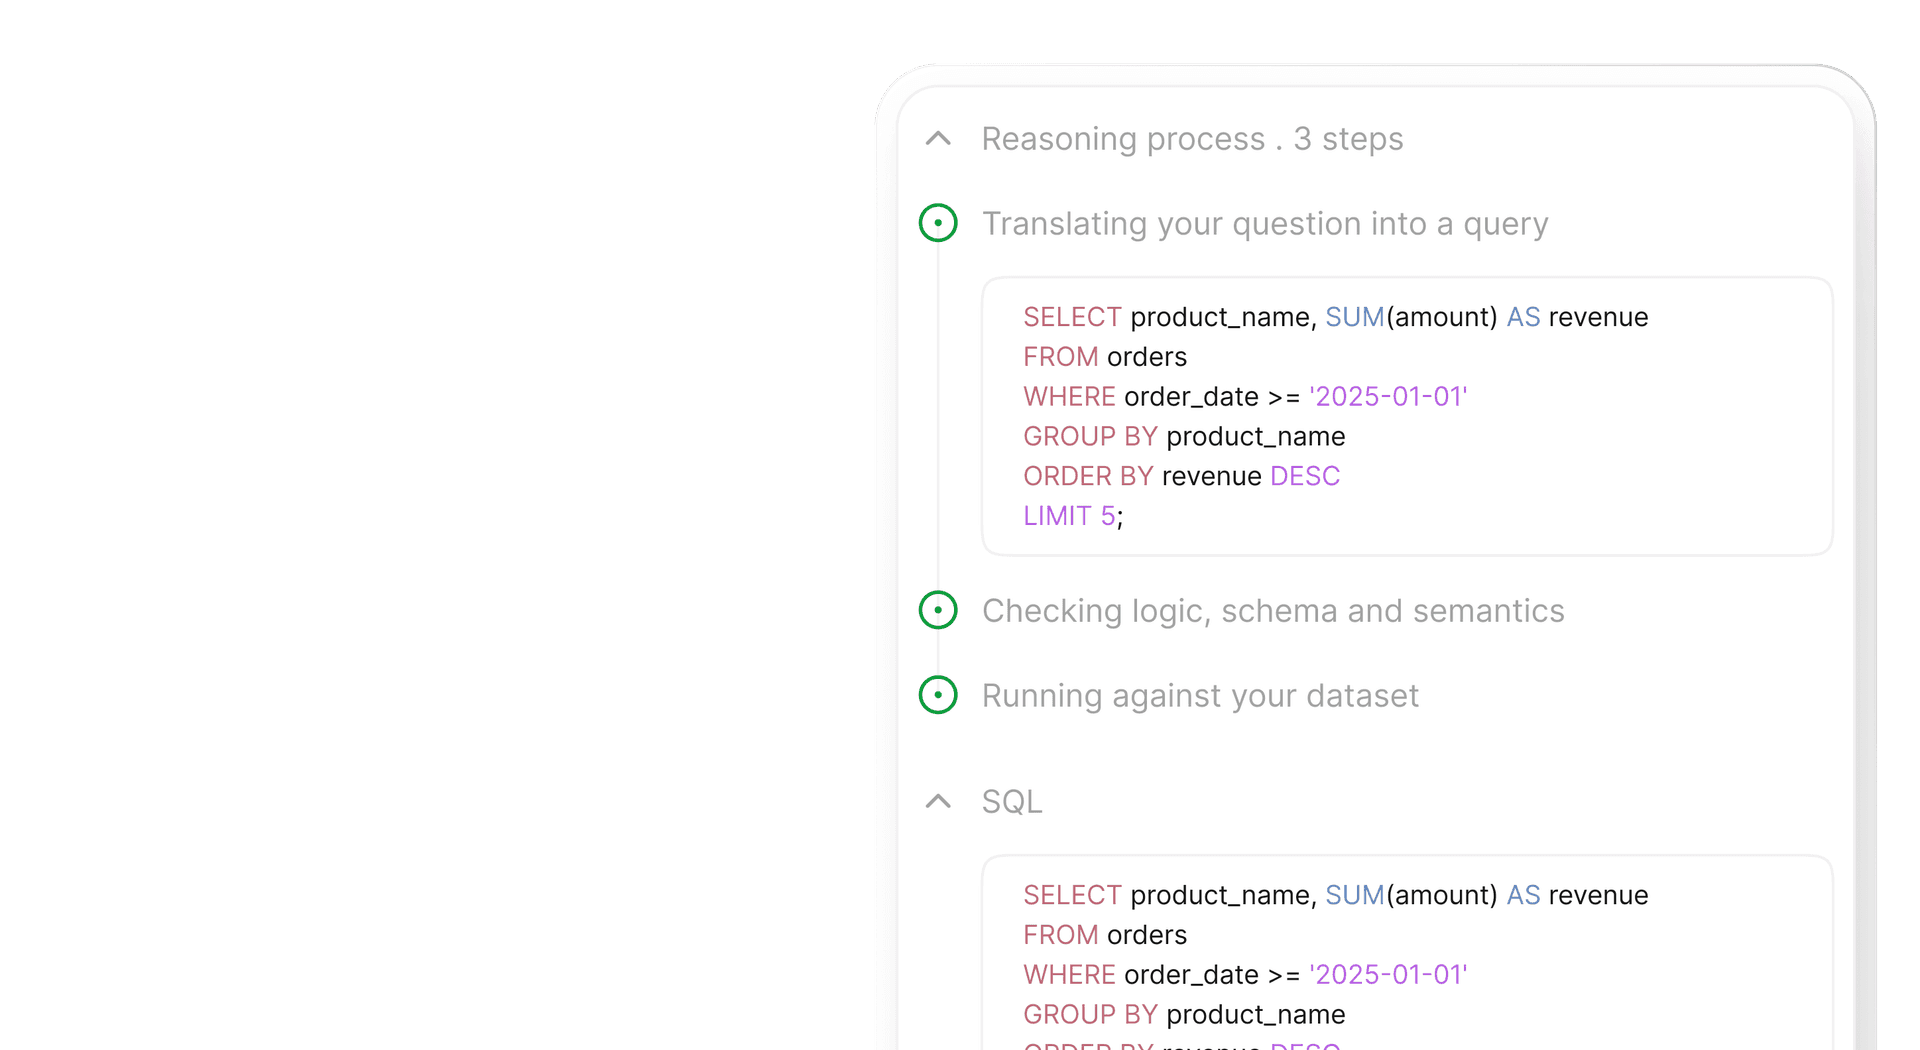
See the SQL, the rows, and the logic behind each result.

AI Insight

Enterprise Suite drives 34% of total revenue — a strong upsell opportunity.

SQL
SELECT product_name, SUM(amount)
FROM orders
WHERE order_date >= '2025-01-01'
GROUP BY product_name
ORDER BY revenue DESC
Confidence94%

Schema match

97%

Query validity

92%

Result shape

93%

Answers you can trust,
no matter the dataset

Catches misleading results

Every answer is checked before you see it.

Confidence Score94%

Schema match

97%

Query validity

92%

Result shape

93%

Column types verified
No null values in GROUP BY
Date range within dataset bounds

Possible outlier

Row 847: revenue 3.2x above segment average

Cleans your messy data

Detects column types, fixes formatting gaps automatically.

QueryBoard

sales_data_q4

12,847 rows · 8 cols

customers_2024

3,420121.8 MBMay 15, 2025

product_catalog

156 rows · 6 cols

marketing_spend

45,2101412.4 MBMay 12, 2025

Built-in audit trail

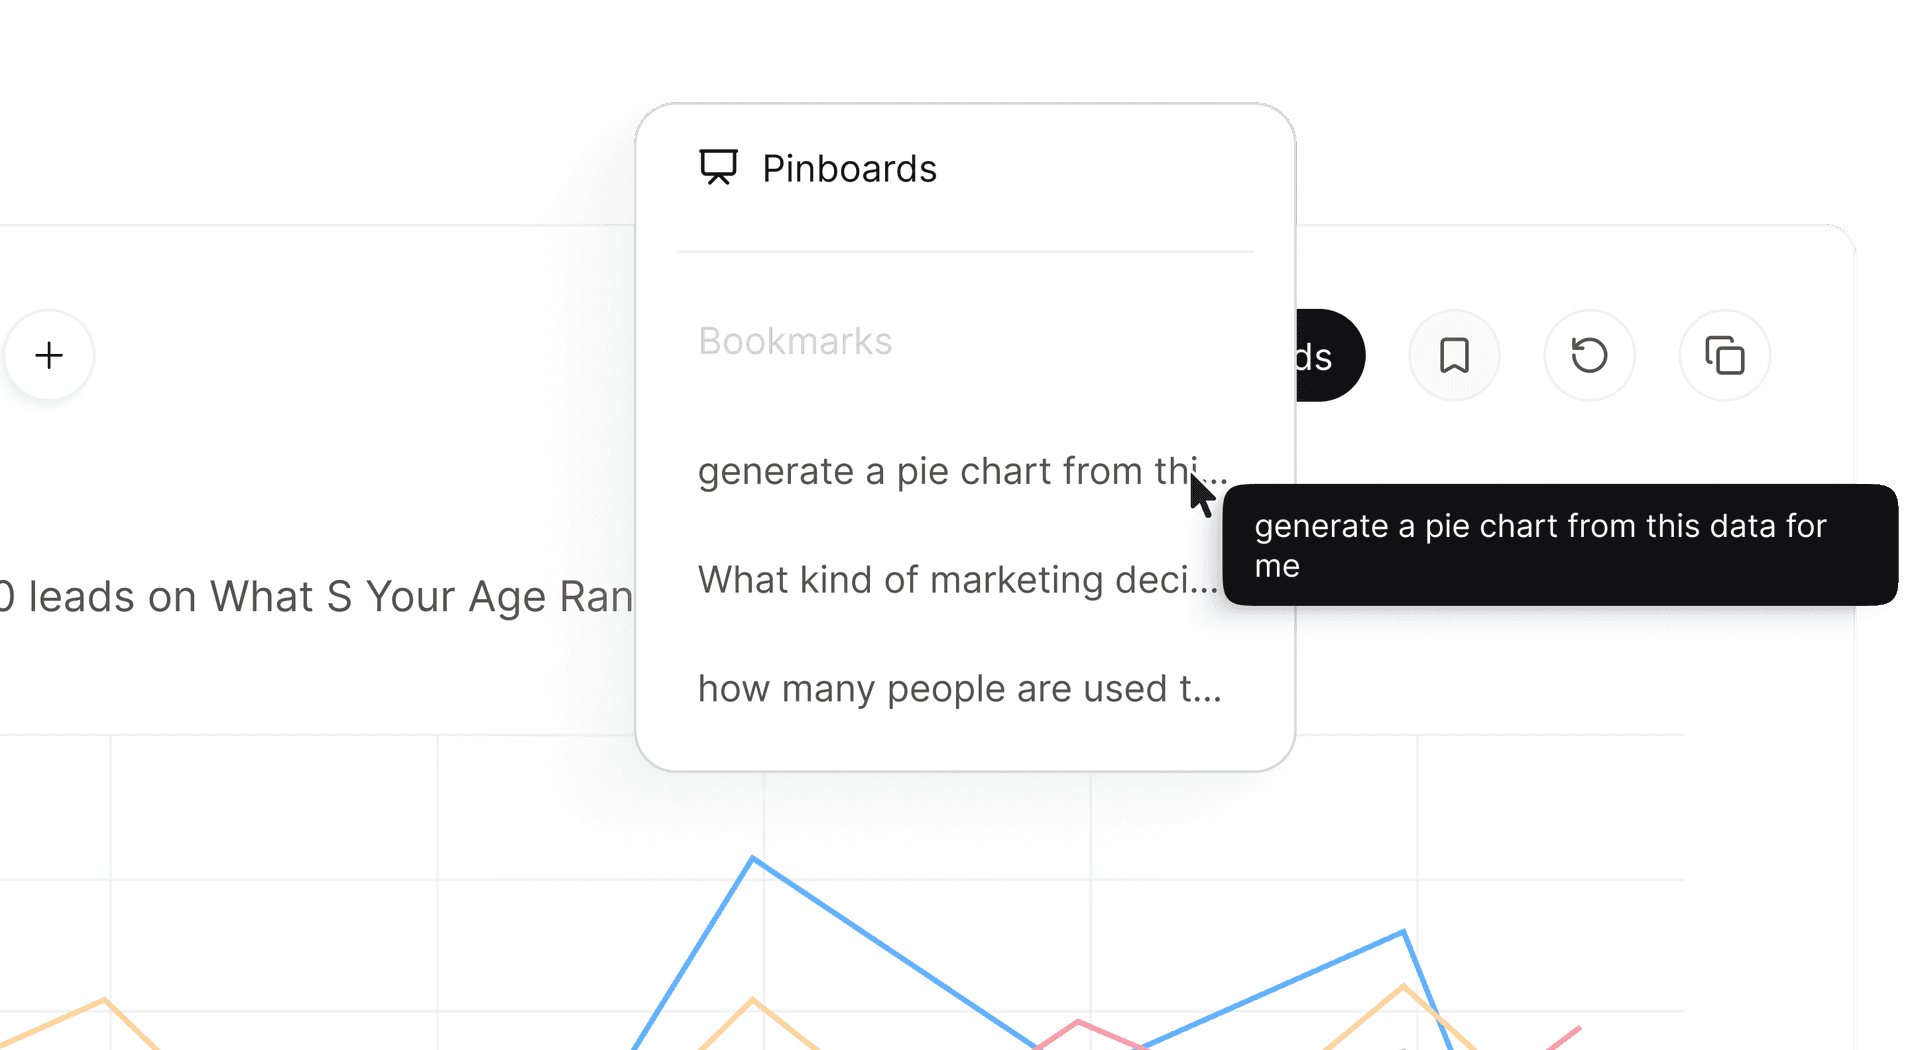
Every query is saved. Come back to any result anytime.

QueryBoard

Top revenue by product last quarter

Churn rate by region Q4

2 min ago

Monthly active users trend

1 hr ago

Average order value by segment

Yesterday

Go from question to insight
before your coffee gets cold

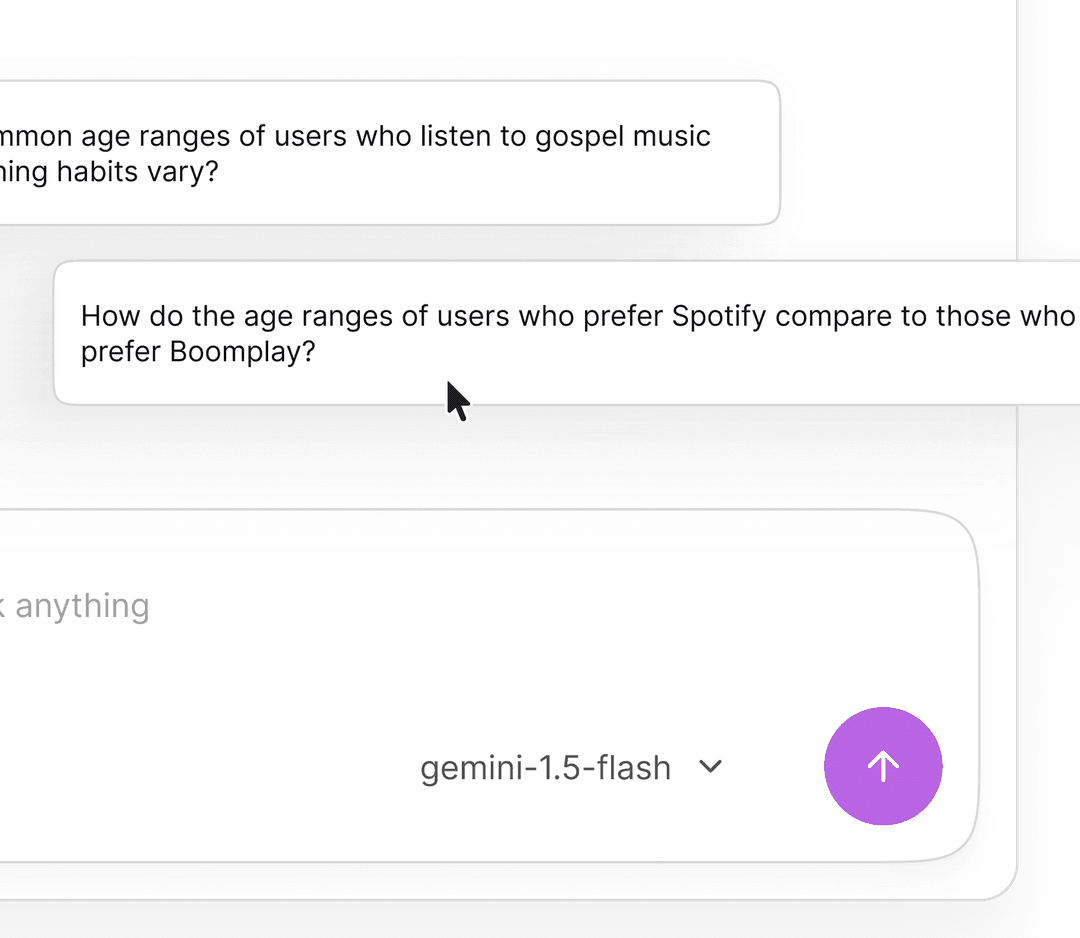
AI-generated follow-ups

Ask a question, get follow-ups you hadn't thought of.

QueryBoard

Which region had the highest churn?

Top-selling product last quarter?Revenue by regionHighest churn segment?Monthly active users trendAverage order value by channel

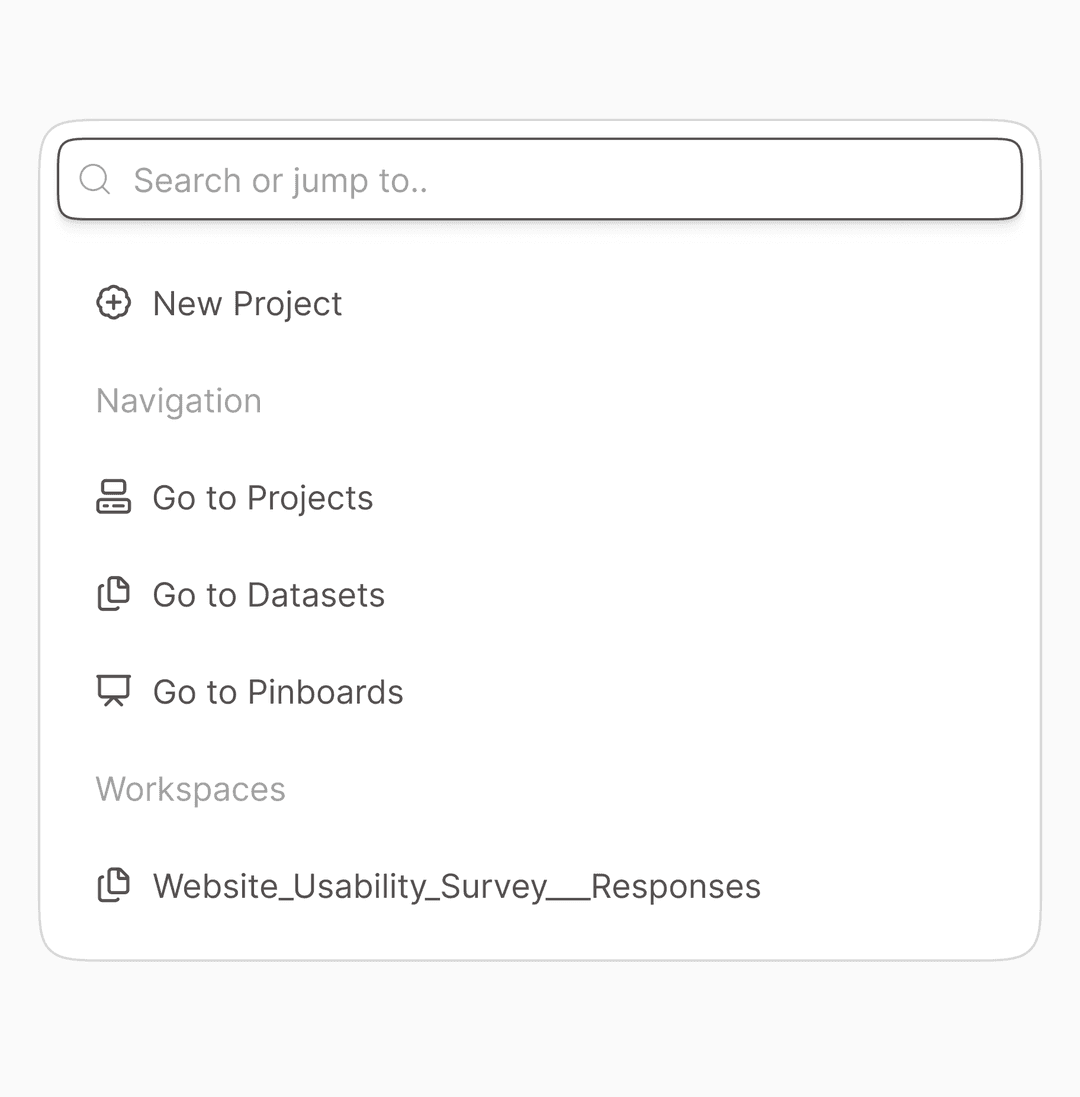
Command palette

Search, navigate, and run actions from one place.

Search or jump to...Ctrl K

Search

Search queries...

Actions

New workspaceCtrlN

Navigation

Go to workspaces
Go to pinboards
Go to datasets

Fast, even on large files

Answers in seconds, even on thousands of rows.

Total revenue by region, last 6 months

Analyzing your data...

Works with the tools and data
you already use

Works with your data sources

Upload CSVs, connect Postgres, MySQL, or Google Drive.

CSV / Excel
Postgres
MySQL
Google Drive

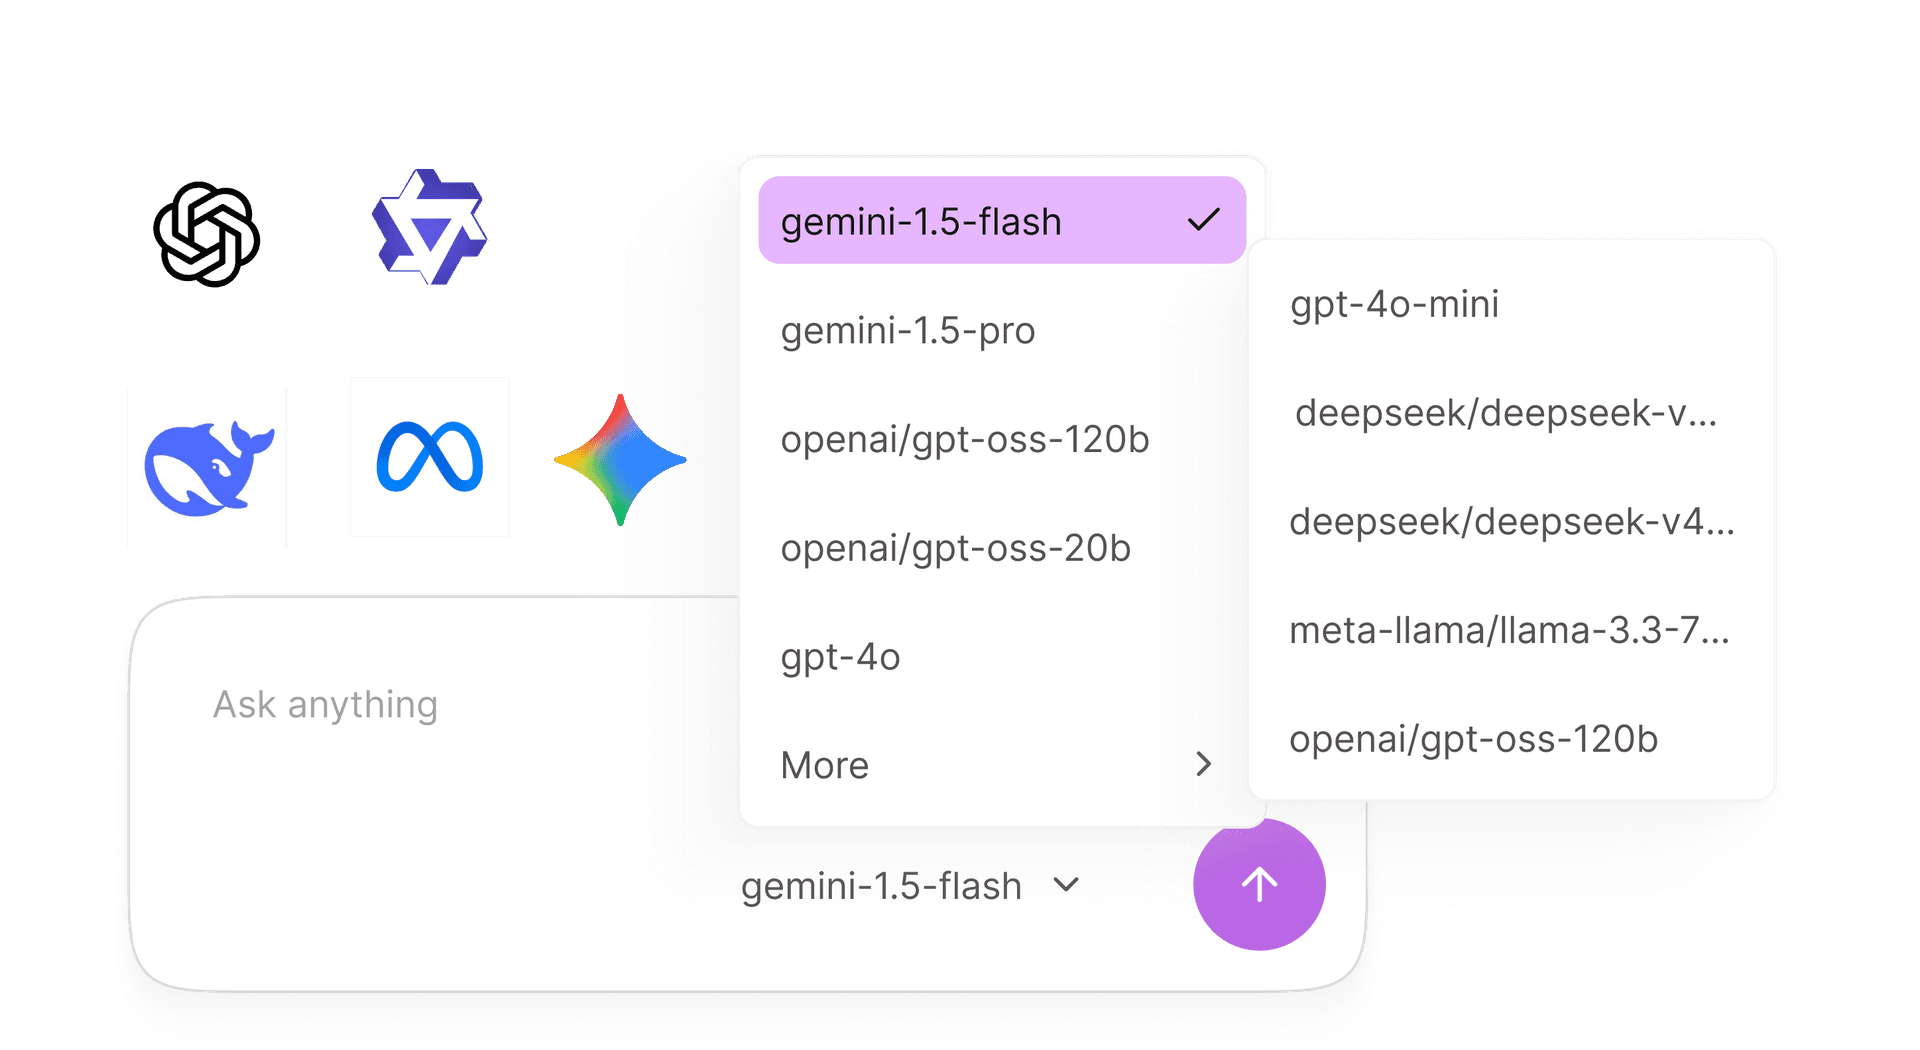
Choose your AI model

Gemini, OpenAI, Groq — choose the right model for your queries.

Google Gemini

2.0 Flash

OpenAI

GPT-4o

Groq

Llama 3.3 70B

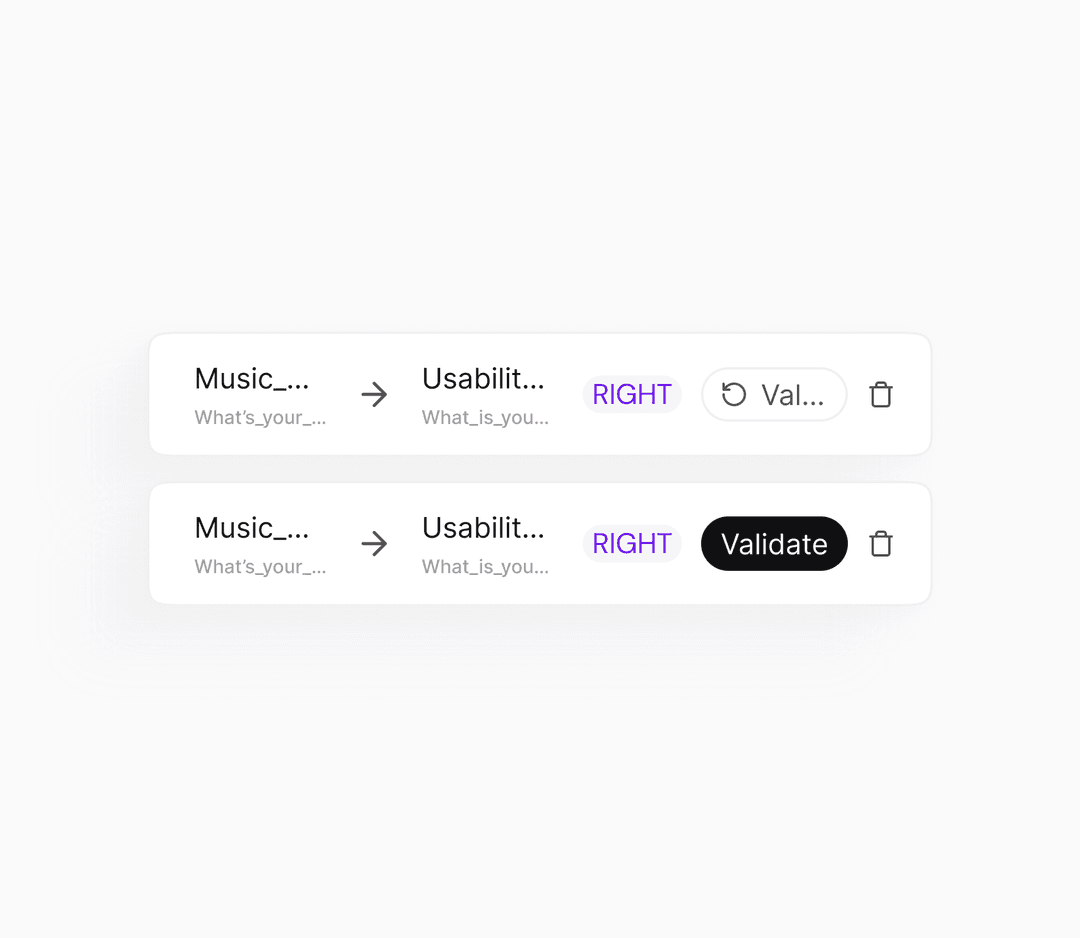
Relationship studio

Define and validate joins across datasets with AI suggestions.

customers

id

orders

customer_id

LEFT97%

orders

product_id

products

id

INNER94%

products

category_id

categories

id

LEFT82%

Turn every finding into
something worth sharing

Pin results to dashboards

Save any answer as a live card on a dashboard.

QueryBoard

Revenue by Region

barMay 20, 2025

Present and share

Turn dashboards into slide decks with a shareable link.

2 / 5

Revenue by Region

Context panel

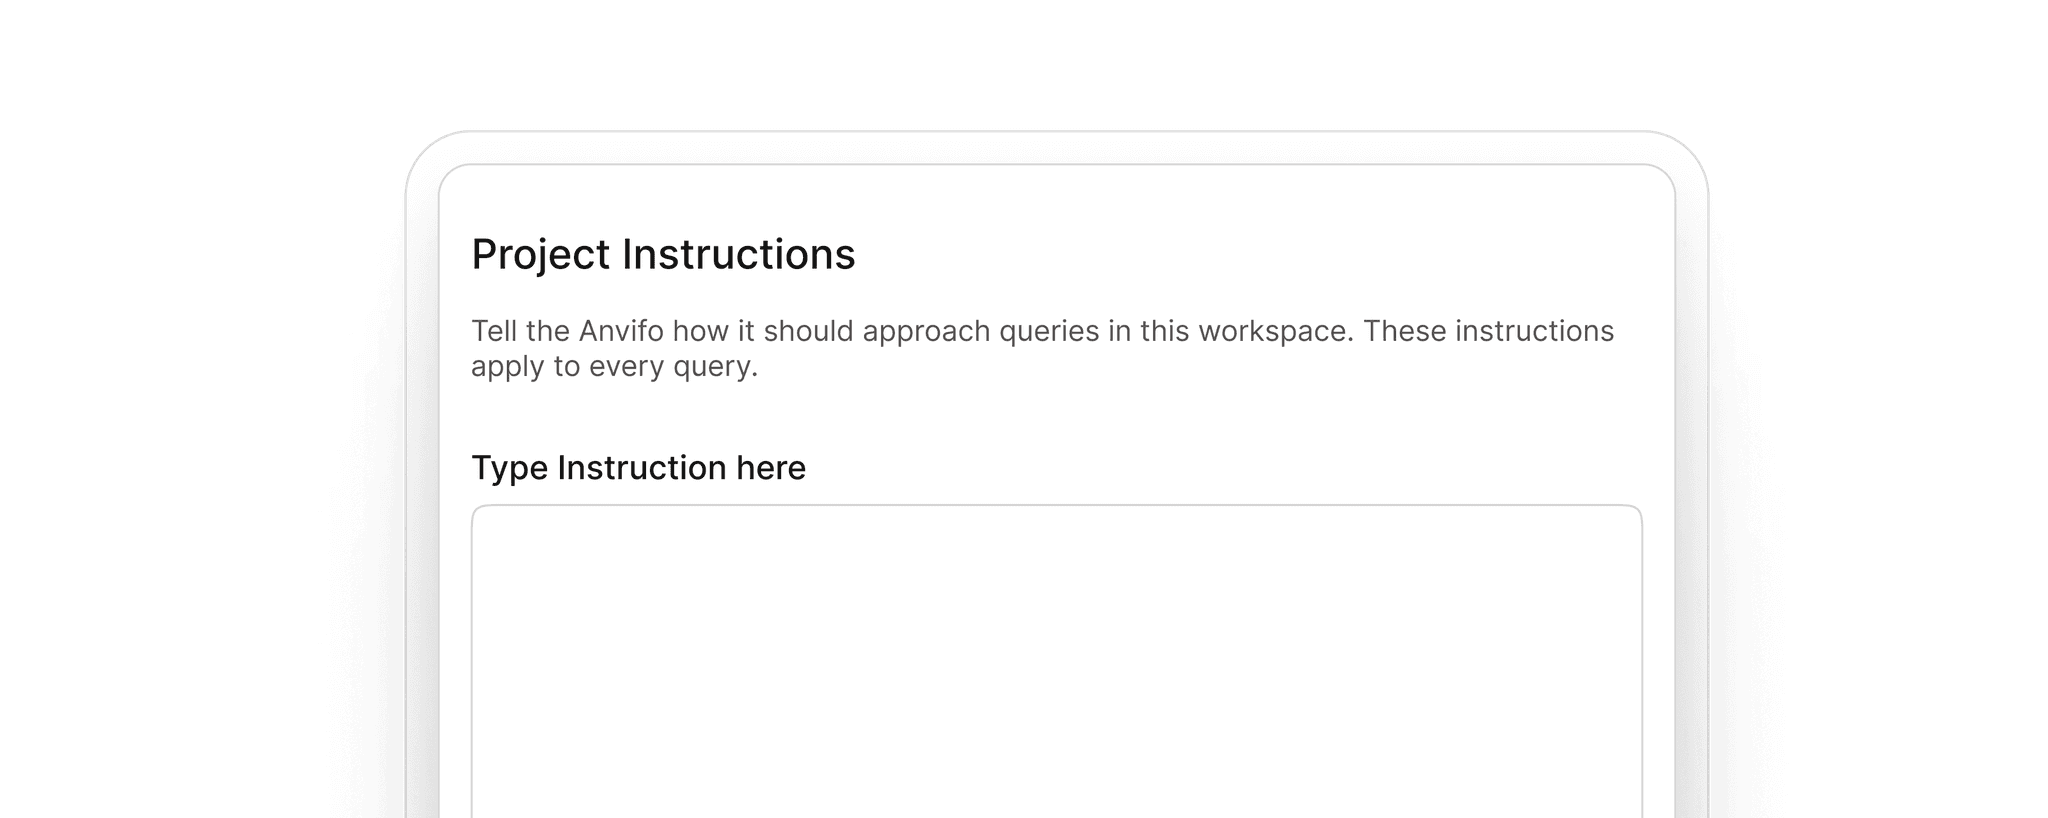
Attach datasets, define relationships, and set workspace instructions.

QueryBoard

Instructions

Focus on revenue trends. Always include year-over-year comparisons.

Relationships

2

customers

id

orders

customer_id

LEFT

Datasets

2

customers

3,420 rows · 8 cols

orders

12,847 rows · 6 cols

Stop making decisions like this. QueryBoard replaces guesswork with verifiable answers.

I think this looks right…

Let's just trust the dashboard

We'll double-check later

The numbers feel off but I'm not sure why

Simple, transparent pricing.
Start free. Pay when you rely on it.

Frequently asked questions

QueryBoard doesn’t just generate answers — it executes queries, validates results, and shows how each answer was produced.

Ready to stop second-guessing your data?

Start with messy files. End with answers you trust.